Published: SEPTEMBER 7, 2026
The true purpose of a DC motor performance curve is not to show an engineer the motor’s maximum speed or maximum torque in isolation, but to help evaluate whether a specific operating point meets the requirements of a practical application.
For example, when an application requires a motor to maintain a target speed under a specific load, knowing only the No-load Speed is insufficient for proper motor selection. Engineers must also verify the actual Speed, Current, Mechanical Output Power, and Efficiency at that specific torque, while ensuring that the current, temperature rise, and duty cycle remain within allowable operating limits.
A practical reading order is: Required Torque → Loaded Speed → Current → Input Power → Output Power → Efficiency → Thermal Limit
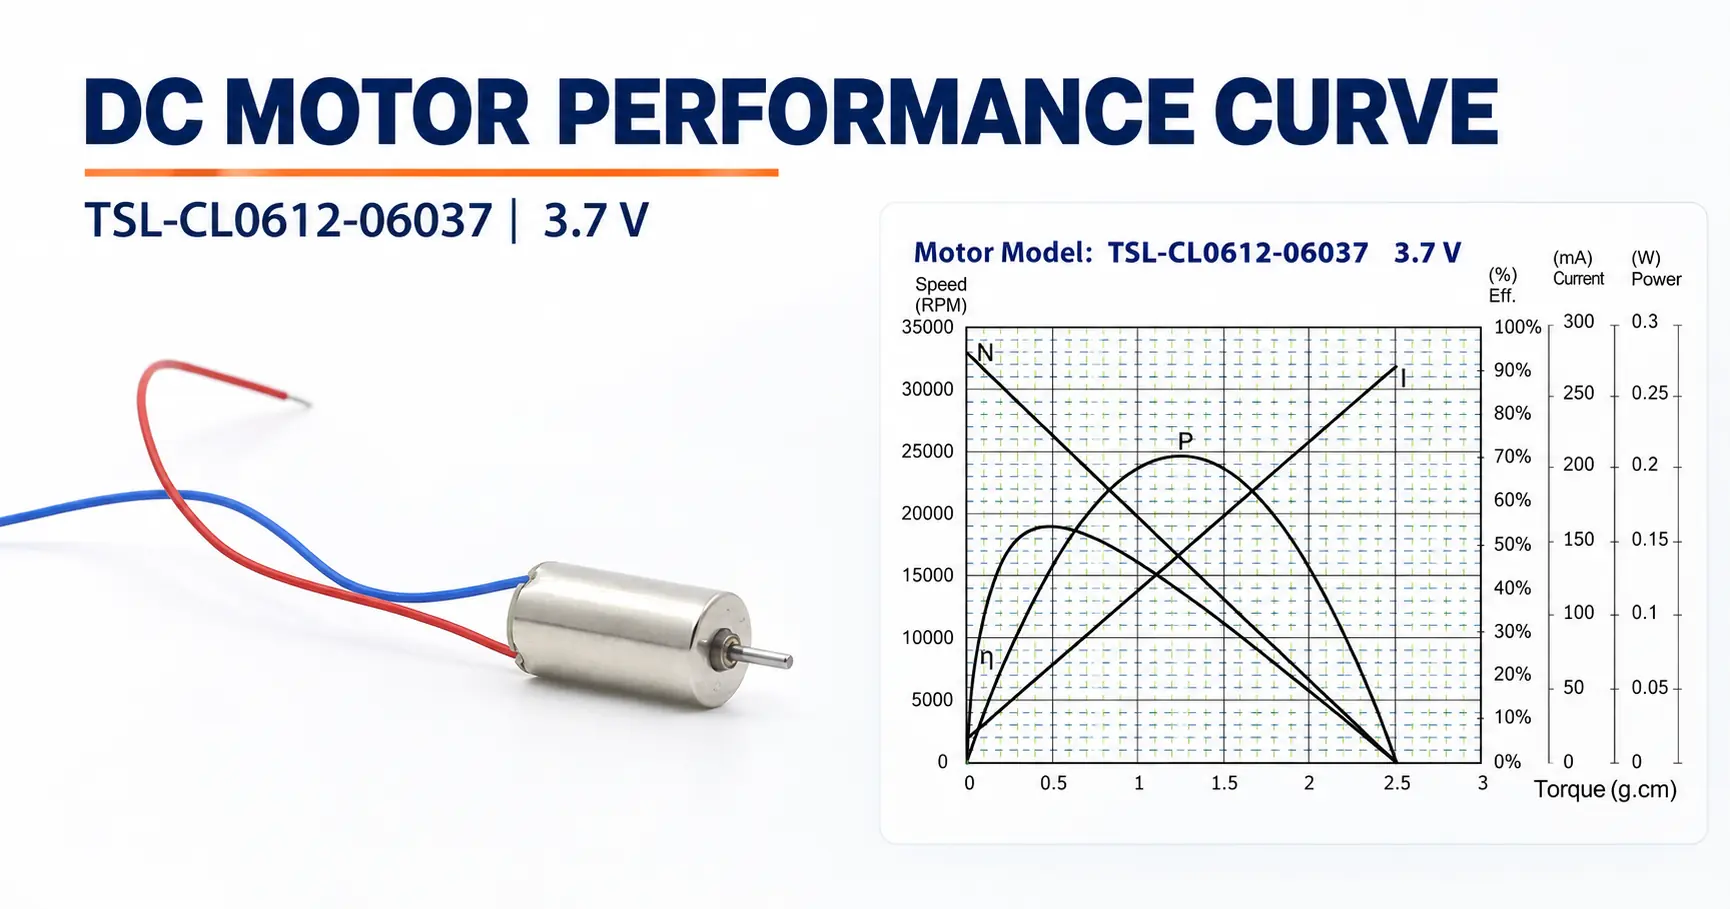
This article uses the 3.7 V winding variant of the 6 mm Coreless DC Motor TSL-CL0612 (TSL-CL0612-06037) as a case study to cross-verify speed, current, power, and efficiency at the same operating point.
Key Takeaways
- Engineers must evaluate the operating point by starting from the required torque.
- No-load speed and stall torque cannot serve as continuous operating metrics.
- Speed/torque slope and torque constant can cross-verify speed and current data.
- Mathematical formulas can confirm the conversion between electrical and mechanical power.
- The maximum power point does not equal the maximum efficiency or continuous operating point.
- Actual terminal voltage drops and driver limits will alter real motor performance.
- Thermal rise, duty cycles, and lifespan requirements must dictate the continuous operating point.
What Does a DC Motor Performance Curve Show?
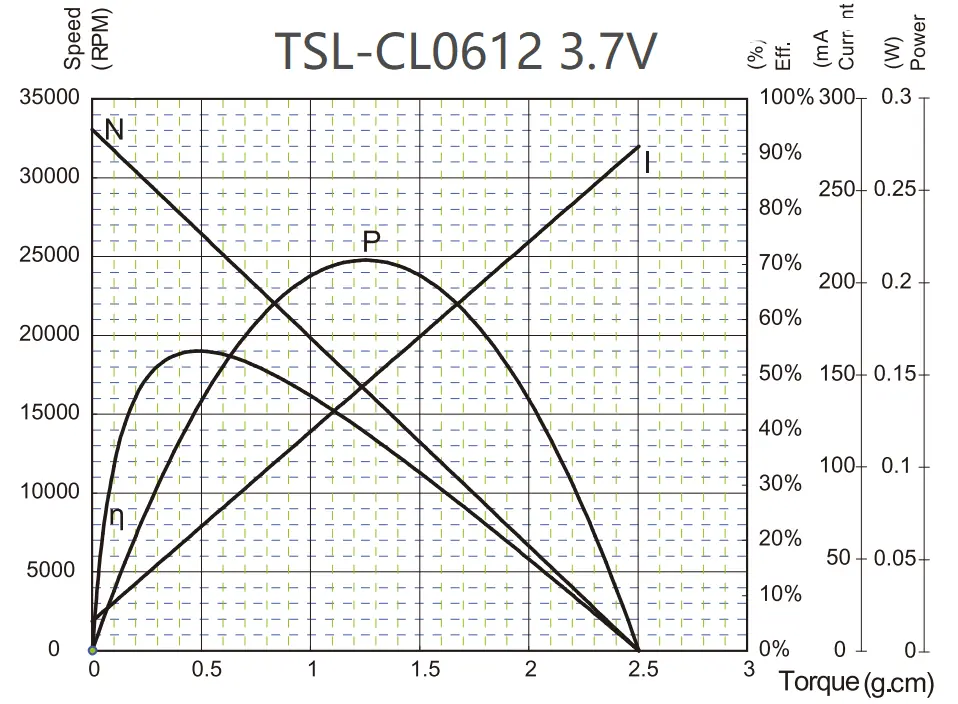
A typical DC motor performance curve plots Torque on the horizontal axis to illustrate how Speed, Current, Output Power, and Efficiency vary with changing load.
| Curve / Parameter | Primary Question Answered |
| Torque–Speed Curve | How much speed can the motor maintain as the load increases? |
| Current Curve | How much current is drawn at the target torque? |
| Electrical Input Power | How much electrical power does the motor draw from the supply? |
| Mechanical Output Power | How much mechanical power is actually delivered at the shaft? |
| Efficiency Curve | What percentage of input electrical power is converted into mechanical output? |
Curve formats vary by manufacturer. Some directly display Efficiency, while others only provide Voltage, Current, Torque, and Speed, requiring formulas for calculation.
Before reading a curve, always verify:
- Exact motor model and winding version
- Rated or test voltage
- Units for torque, speed, and current
- Whether the curve applies to a bare motor or a gearmotor
- Ambient temperature and test conditions
- Whether the data represents instantaneous test values or continuous ratings
If the model, winding, or voltage differs, the data cannot be used directly—even if the curve shape appears identical.
How Are Torque, Speed, and Current Related?
For permanent magnet brushed DC motors operating within a limited range at a constant voltage, the Torque–Speed relationship can be approximated as a linear decline.
As load torque increases, the motor requires more armature current to generate electromagnetic torque. Higher current causes an increased voltage drop across the winding resistance, leaving less voltage for Back EMF, which results in a speed drop.
Two key boundary points are:
- No-load point: External load torque approaches zero, and motor speed approaches its maximum value at that voltage.
- Stall point: The rotor stops, speed drops to zero, and current and torque approach their stall values.
Real operating points lie between these two boundaries. No-load Speed cannot serve as the loaded operating speed, nor can Stall Torque be used for continuous operation.
In a simplified model, the relationship between torque and current is expressed as:
T ≈ Kₜ × (I − I₀)
Where:
- T: Output torque
- Kₜ: Torque constant
- I: Motor current
- I₀: No-load current
Subtracting I₀ accounts for the current required to overcome internal losses such as brush friction, bearing resistance, and windage, even without an external load. This is an engineering approximation, as actual frictional losses can vary with speed and temperature.
The MIT DC motor model similarly expresses terminal voltage as the combination of Back EMF and resistance voltage drop, correlating shaft torque with current minus internal loss current.
Input Power, Output Power, and Efficiency
Electrical Input Power and Mechanical Output Power must not be confused.
Electrical input power:
Pᵢₙ = V × I
Mechanical output power:
Pₒᵤₜ = T × ω
When speed is expressed in rpm:
ω = 2πn ÷ 60
Therefore:
Pₒᵤₜ = T × 2πn ÷ 60
Note: Torque must be in N·m and speed in rpm to yield power in W.
Motor efficiency:
η = Pₒᵤₜ ÷ Pᵢₙ × 100%
At the no-load point, speed is high but torque is near zero, resulting in near-zero mechanical output power. At the stall point, torque reaches its maximum, but speed is zero, again yielding zero mechanical output power. Consequently, Output Power peaks between no-load and stall.
For an ideal linear Torque–Speed model, Maximum Mechanical Power occurs near half of the Stall Torque and half of the No-load Speed. UC San Diego DC motor instructional materials demonstrate this idealized relationship.
However:Maximum Power Point ≠ Maximum Efficiency Point ≠ Recommended Continuous Operating Point
Real Example: TSL-CL0612-06037
This section analyzes the 3.7 V winding variant of the TSL-CL0612 series:
| Parameter | TSL-CL0612-06037 |
|---|
| Nominal Voltage | 3.7 V |
| No-load Speed | 48,100 rpm |
| No-load Current | 45 mA |
| Maximum Efficiency | 55% |
| Speed at Maximum Efficiency | 38,700 rpm |
| Current at Maximum Efficiency | 187 mA |
| Torque at Maximum Efficiency | 0.94 g·cm |
| Stall Current | 0.77 A |
| Stall Torque | 4.83 g·cm |
| Terminal Resistance | 4.8 Ω |
| Torque Constant | 6.7 g·cm/A |
| Speed/Torque Slope | 9,940 rpm/(g·cm) |
These parameters are interdependent. Three cross-checks demonstrate their consistency at a single operating point.
Torque–Speed Cross-Check
Starting from No-load Speed:
n ≈ n₀ − 9,940T
Substituting:
T = 0.94 g·cm
n ≈ 48,100 − 9,940 × 0.94 ≈ 38,756 rpm
In the product sheet, the Speed at Maximum Efficiency is 38,700 rpm, while the linear model yields a calculated value of approximately 38,756 rpm, showing a difference of around 56 rpm. This discrepancy only indicates that the calculated result is consistent with the standard specification value, and does not mean the speed tolerance for each individual motor is merely 0.15%.
The performance curves are derived from sample measurements, and values listed in the product sheet shall be regarded as typical parameters for reference‑standard motors. Actual speed for individual motors normally allows a deviation of approximately ±10%. Accordingly, both the calculated and measured results fall within the normal error margin.
Torque–Current Cross-Check
Using:
I ≈ I₀ + T ÷ Kₜ
Substituting values:
I ≈ 0.045 + 0.94 ÷ 6.7 ≈ 0.185 A
The calculated result is approximately 185 mA, while the corresponding current in the product sheet is 187 mA. This minor discrepancy originates from parameter rounding.
Power and Efficiency Cross-Check
Electrical input power:
Pᵢₙ = 3.7 × 0.187 ≈ 0.692 W
Converting:
0.94 g·cm ≈ 9.21 × 10⁻⁵ N·m
Angular velocity at 38,700 rpm:
ω = 2π × 38,700 ÷ 60 ≈ 4,053 rad/s
Mechanical output power:
Pₒᵤₜ ≈ 9.21 × 10⁻⁵ × 4,053 ≈ 0.373 W
Efficiency:
η ≈ 0.373 ÷ 0.692 × 100% ≈ 54.0%
This matches closely with the 55% Maximum Efficiency on the datasheet. The approx 1% difference stems from rounding across Torque, Speed, Current, and unit conversions.
The value of this exercise lies in using the Speed/Torque Slope, Torque Constant, and power equations to ensure that Torque, Speed, Current, and Efficiency correspond accurately at a given operating point.
Stall, Maximum Power, and Continuous Operation
The TSL-CL0612-06037 has a Terminal Resistance of 4.8 Ω. At stall, speed and Back EMF drop to zero, yielding the simplified resistance model:
Iₛₜₐₗₗ ≈ V ÷ R
Iₛₜₐₗₗ ≈ 3.7 ÷ 4.8 ≈ 0.771 A
This calculated value aligns with the 0.77 A Stall Current listed on the datasheet.
Electrical input power at stall:
Pᵢₙ ≈ 3.7 × 0.77 ≈ 2.85 W
Because speed is zero:
Pₒᵤₜ = T × 0 = 0
In a simplified model ignoring brush and wiring losses, almost all input power converts to winding heat. Therefore, Stall Torque represents a performance boundary, not a Continuous Torque rating.
According to the ideal linear model, the Maximum Power Point occurs near:
- Torque:4.83 ÷ 2 ≈ 2.42 g·cm
- Speed:48,100 ÷ 2 ≈ 24,050 rpm
However, this does not mean the motor can run continuously at this point. Current and copper losses rise significantly in the Maximum Power region.
Continuous operation capability requires evaluating:
- Continuous Current and Continuous Torque limits
- Maximum allowable winding temperature
- Ambient operating temperature
- Mounting configuration and heat dissipation
- Duty cycle
- Brush and commutator lifespan
While published specs define characteristic points like No-load, Max Efficiency, and Stall, they do not fully define continuous thermal limits.
Why Voltage, Driver Limits, and Temperature Matter
Performance curves correspond to specific test voltages—3.7 V in this example. If an actual system delivers only 3.3 V to the motor terminals under load, the 3.7 V curve data cannot be applied directly.
Real-world performance is also influenced by:
- Battery voltage sag
- PWM duty cycle
- Driver voltage drop
- Driver current limiting
- Cable and connector resistance
- Power supply current capacity
If a motor driver enforces a current limit, performance in high-torque regions will truncate early, causing the actual Torque–Speed relationship to deviate from the original curve. Always measure the loaded Motor Terminal Voltage rather than relying solely on the power supply nameplate rating.
Temperature also alters performance. As copper winding temperature rises, Resistance increases. At a given supply voltage and target torque, higher resistance voltage drops leave less voltage for Back EMF, causing thermal-state speed to fall below cold-test results.
Consequently, a performance curve measured over a short duration at room temperature does not represent all ambient temperatures or continuous operating conditions.
Practical Reading Workflow and Common Mistakes
When reviewing a new DC motor performance curve, follow this sequence:
- Confirm the Motor Model, Winding, Voltage, Units, and test conditions.
- Start from the Required Torque rather than No-load Speed or Stall Torque.
- Read the Loaded Speed at the target Torque.
- Read the corresponding Current, then verify the power supply, driver, and wiring harness.
- Separately calculate Electrical Input Power and Mechanical Output Power.
- Calculate Efficiency, checking units and data for internal consistency.
- Finally, check Continuous Current, Temperature, Duty Cycle, and Lifetime limits.
| Common Mistake | Why It Is Wrong | Correct Approach |
| Using No-load Speed as operating speed | Speed drops when load is applied | Read Speed at the Required Torque |
| Using Stall Torque for continuous operation | High current causes excessive heating at stall | Verify Continuous and Thermal Limits |
| Looking only at the Torque–Speed Curve | Ignores current draw and temperature rise | Read Current simultaneously |
| Assuming V × I is output power | V × I represents Electrical Input Power | Calculate output power using T × 2πn/60 |
| Equating Max Efficiency with Max Power | They occur at different operating points | Evaluate and calculate each separately |
| Assuming curve reachability implies continuous operation | Characteristic limits differ from Continuous Ratings | Verify against temperature, duty cycle, and lifespan |
| Mixing data across different windings | Different windings in the same series vary in specs | Stick strictly to the exact model and winding |
| Ignoring actual terminal voltage drop | Drivers and wiring induce voltage drops | Measure Motor Terminal Voltage under load |
Performance curves serve well for initial winding selection and target point verification, but physical sample testing and thermal validation remain necessary.
If project requirements already specify Voltage, Loaded Speed, Continuous Torque, Starting Load, Duty Cycle, mounting dimensions, and ambient temperature, refer to the TSL Motor DC Motor Series or Coreless DC Motor Series.
For the formal design-in phase, review datasheets, engineering drawings, and test reports available at the TSL Motor Download Center.
Frequently Asked Questions
How do you read a DC motor performance curve?
First, verify the motor model, winding, test voltage, and units. Starting from the required torque, read the corresponding speed and current, then calculate input power, output power, and efficiency. Finally, verify continuous current, temperature, duty cycle, and lifespan limits.
Why does DC motor current increase with torque?
A permanent magnet DC motor requires higher armature current to generate greater electromagnetic torque. Because even an unloaded motor draws current to overcome brush friction, bearing resistance, and internal losses, the Torque–Current relationship must account for No-load Current.
Is stall torque safe for continuous operation?
No. At stall, speed and Back EMF drop to zero, causing high current draw and rapid winding heat accumulation. Stall Torque represents a short-term performance boundary and must not be used as a Continuous Torque rating.
Conclusion
The key to correctly reading a DC motor performance curve is not finding the highest numbers on the chart, but identifying the actual Operating Point. Engineers should begin with the required torque and systematically evaluate the corresponding speed, current, input power, output power, and efficiency.
The TSL-CL0612-06037 case study illustrates how Torque, Speed, Current, and Efficiency at a single operating point can be cross-verified using the Speed/Torque Slope, Torque Constant, Resistance, and power formulas. This method confirms curve accuracy while helping identify unit conversion errors, winding mix-ups, or parameter inconsistencies.
Finally, always distinguish Performance Capability from Continuous Capability. Stall Torque, Maximum Power, and Maximum Efficiency are feature points on a curve; a viable production design point must independently satisfy current, temperature, duty cycle, and lifespan requirements.